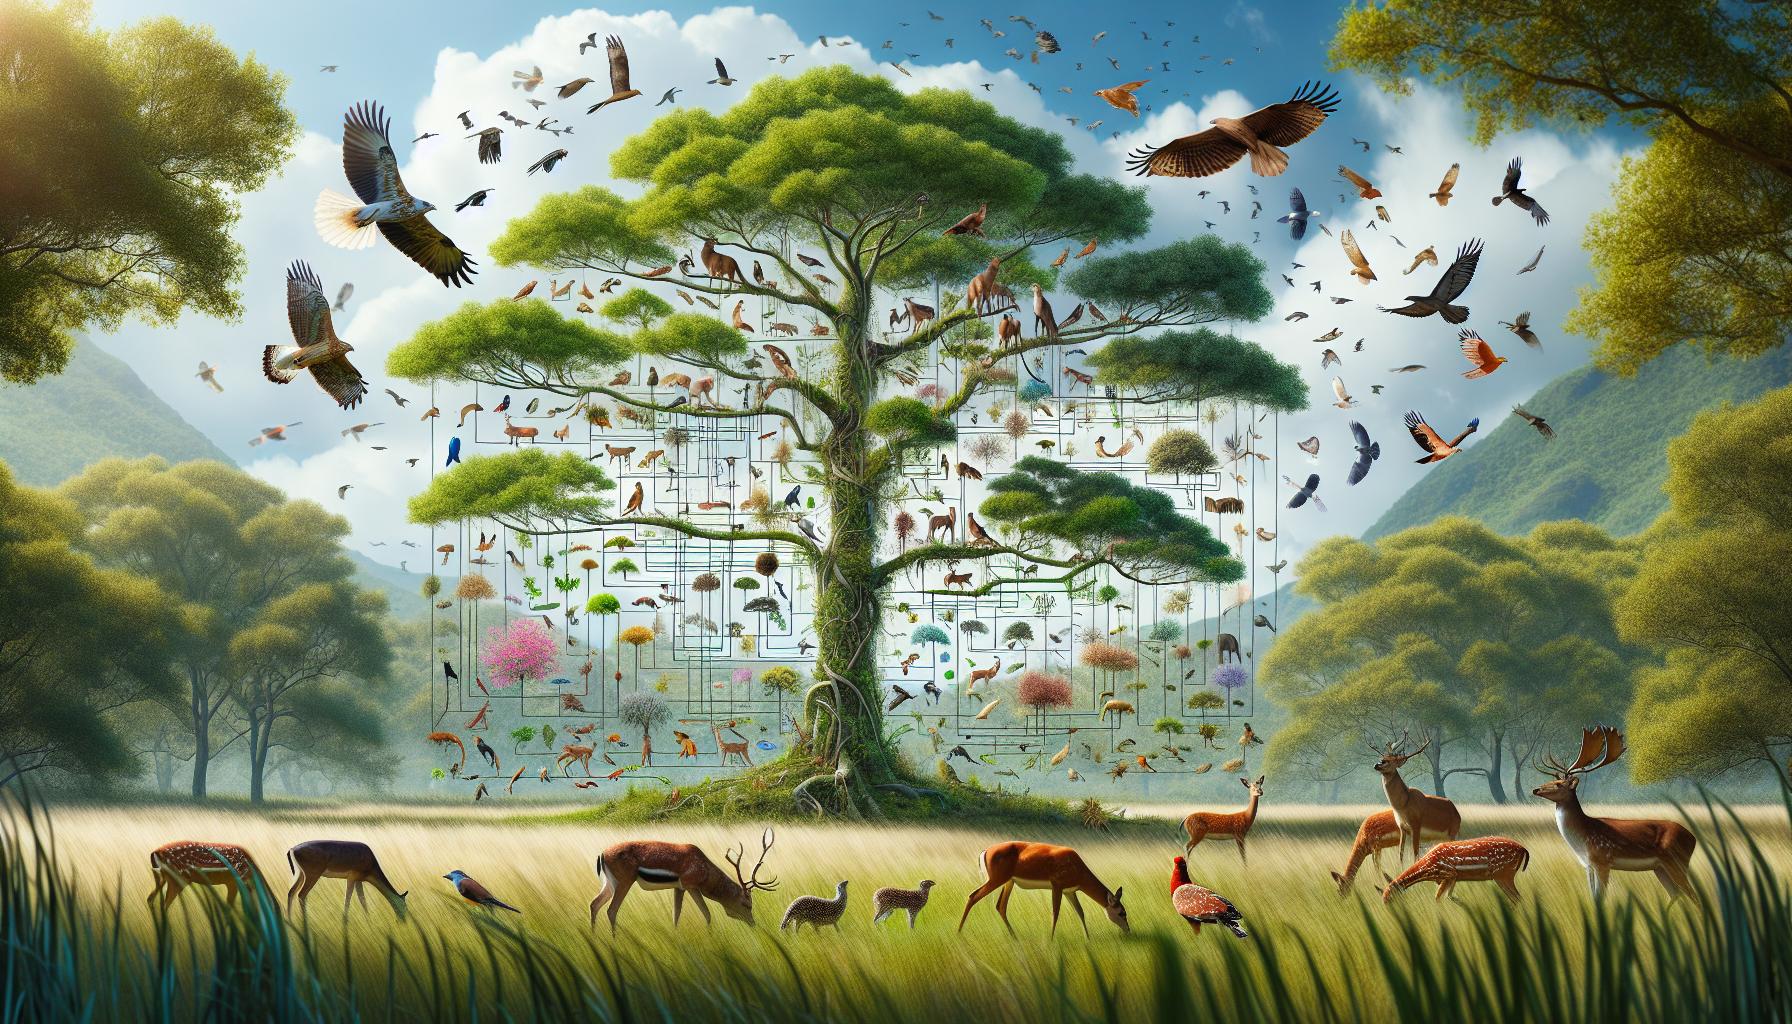
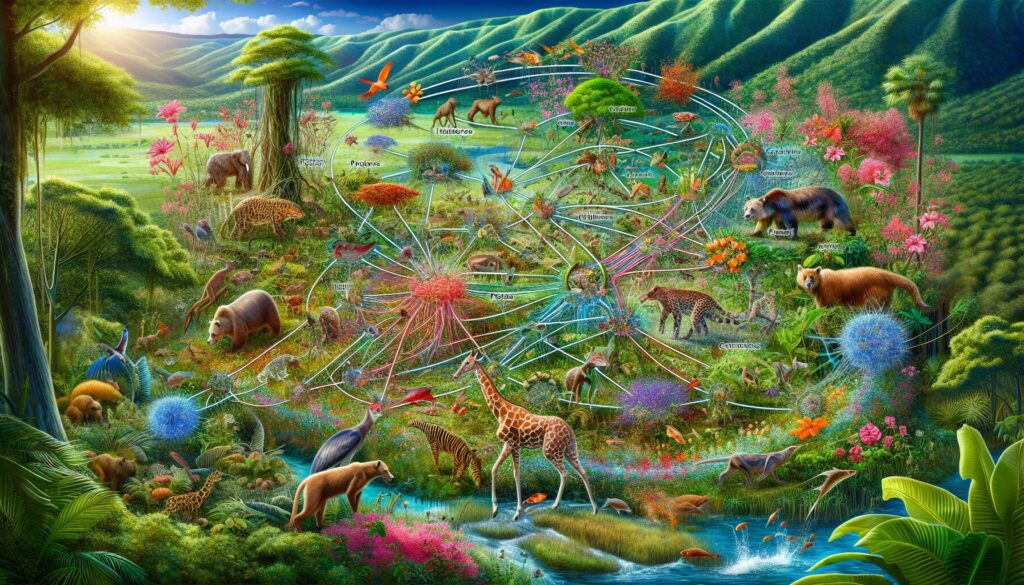
Food webs serve as intricate maps that illustrate the complex relationships between different species in an ecosystem. These interconnected networks showcase how energy flows through various organisms from producers to consumers creating a fascinating display of biodiversity within a given environment.
By examining food webs scientists can observe the diverse range of species and their roles in maintaining ecosystem balance. Each connection in a food web represents a unique feeding relationship demonstrating how different organisms depend on one another for survival. The more connections present in a food web the greater the biodiversity of that ecosystem indicating a healthier and more resilient natural community.
Understanding Food Webs and Their Components
Food webs illustrate the complex feeding relationships between organisms in an ecosystem through interconnected networks of predator-prey interactions. These intricate diagrams map out how energy transfers between species across different ecological roles.
Trophic Levels and Energy Flow
Trophic levels form distinct layers in food webs, starting with producers at the base. Each level represents a specific role in energy transfer:
- Producers (Trophic Level 1)
- Convert solar energy into chemical energy through photosynthesis
- Include plants, algae, phytoplankton
- Form the foundation of most terrestrial food webs
- Primary Consumers (Trophic Level 2)
- Feed directly on producers
- Include herbivores like rabbits, grasshoppers, deer
- Transfer approximately 10% of available energy to the next level
- Secondary Consumers (Trophic Level 3)
- Consume primary consumers
- Include carnivores like snakes, owls, foxes
- Obtain about 1% of the original energy from producers
- Direct Dependencies
- Predator-prey relationships
- Host-parasite associations
- Pollinator-plant connections
- Indirect Relationships
- Competition for resources
- Mutually beneficial associations
- Shared predator impacts
- Network Stability Factors
- Multiple food sources for each species
- Alternative prey options
- Redundant ecological roles
- Population control mechanisms
| Interaction Type | Energy Transfer Rate | Ecosystem Impact |
|---|---|---|
| Producer to Primary Consumer | 10% | High |
| Primary to Secondary Consumer | 1% | Moderate |
| Secondary to Tertiary Consumer | 0.1% | Low |
How Does a Food Web Show Biodiversity

Food webs serve as visual maps that demonstrate ecosystem biodiversity through interconnected species relationships. These intricate networks reveal the complexity of natural systems by showcasing the variety of organisms present and their ecological interactions.
Species Richness Within Food Webs
Species richness in food webs reflects the total number of distinct species present in an ecosystem. A food web containing 50 different species indicates greater biodiversity than one with 20 species. Healthy ecosystems typically display multiple species at each trophic level:
- Primary producers: Trees, grasses, algae
- Primary consumers: Grasshoppers, deer, zooplankton
- Secondary consumers: Spiders, birds, small fish
- Tertiary consumers: Hawks, wolves, large fish
| Trophic Level | Average Species Count in Healthy Terrestrial Ecosystems |
|---|---|
| Producers | 100-1000+ |
| Primary Consumers | 50-200 |
| Secondary Consumers | 20-100 |
| Tertiary Consumers | 5-20 |
- Direct feeding links: Predator-prey relationships, herbivore-plant interactions
- Alternative food sources: Multiple prey options for predators
- Competitive relationships: Species sharing common food resources
- Omnivorous connections: Species feeding across multiple trophic levels
| Connection Type | Average Number per Species |
|---|---|
| Direct Feeding Links | 2-5 |
| Alternative Food Sources | 3-8 |
| Competitive Interactions | 4-12 |
| Omnivorous Pathways | 2-6 |
Measuring Biodiversity Through Food Web Analysis
Food web analysis provides quantitative metrics for assessing ecosystem biodiversity through species interactions and feeding relationships. Scientists examine specific parameters within food webs to evaluate the health and complexity of ecological systems.
Network Complexity
Network complexity in food webs reveals biodiversity through connection density and interaction patterns. A typical healthy ecosystem contains 15-40 connections per species, with each connection representing a distinct feeding relationship. Food web metrics include:
- Connectance values ranging from 0.026 to 0.315 in natural ecosystems
- Link density averaging 8-12 interactions per species in terrestrial environments
- Compartmentalization indices measuring distinct subgroups within the network
- Path length calculations showing average steps between any two species
- Shannon-Wiener diversity index values between 1.5 and 3.5 for healthy systems
- Evening scores measuring population balance across trophic levels
- Relative abundance ratios between predator and prey species
- Spatial distribution patterns across different habitat zones
- Species richness indicators showing unique species count per trophic level
| Trophic Level | Average Species Count | Typical Abundance Ratio |
|---|---|---|
| Producers | 25-50 | 1:1 |
| Primary Consumers | 15-30 | 1:10 |
| Secondary Consumers | 8-15 | 1:100 |
| Tertiary Consumers | 3-8 | 1:1000 |
Impact of Food Web Disruptions on Biodiversity
Food web disruptions create ripple effects throughout ecosystems that alter species interactions and reduce biodiversity. These disturbances manifest through extinction cascades and changes in ecosystem stability.
Extinction Cascades
Extinction cascades occur when the loss of one species triggers subsequent extinctions of dependent species. Here’s how extinction cascades impact food webs:
- Primary extinctions eliminate key predators that regulate prey populations
- Secondary extinctions affect specialist species with limited food sources
- Tertiary impacts spread to mutualistic partners like pollinators and seed dispersers
- Keystone species losses destabilize entire trophic levels
- Bottom-up cascades start with producer extinctions, affecting all consumers above
| Cascade Type | Time to Impact | Species Loss Rate |
|---|---|---|
| Top-down | 1-3 years | 15-25% |
| Bottom-up | 3-5 years | 30-45% |
| Keystone | < 1 year | 40-60% |
- Species redundancy provides backup functions when populations decline
- Trophic complexity creates multiple energy pathways
- Population size buffers against local extinctions
- Genetic diversity enables adaptation to environmental changes
- Spatial connectivity allows species recolonization
| Stability Measure | Healthy Range | Critical Threshold |
|---|---|---|
| Species Redundancy | 3-5 species/function | < 2 species |
| Trophic Links | 2-4 per species | < 1.5 per species |
| Population Size | > 500 individuals | < 50 individuals |
| Genetic Variation | > 85% | < 70% |
Conservation Applications of Food Web Studies
Food web studies provide critical insights for conservation efforts by revealing the complex relationships between species and their roles in ecosystem stability. These studies enable conservationists to identify crucial intervention points and develop targeted protection strategies.
Identifying Keystone Species
Food web analysis identifies keystone species through their disproportionate impact on ecosystem structure. These species maintain biodiversity by influencing multiple trophic levels despite their relatively low biomass. Examples include:
- Top predators control prey populations (sea otters regulating sea urchins)
- Ecosystem engineers modify habitats (beavers creating wetland environments)
- Foundation species support numerous dependent species (coral reefs hosting marine life)
- Mutualists facilitate critical interactions (fig wasps pollinating specific fig species)
| Keystone Type | Impact Factor | Species Supported |
|---|---|---|
| Top Predator | 3.5x | 15-20 species |
| Ecosystem Engineer | 4.2x | 25-30 species |
| Foundation Species | 5.1x | 100+ species |
| Mutualist | 2.8x | 10-15 species |
- Creating protected corridors between habitats
- Restoring degraded feeding grounds
- Implementing seasonal hunting restrictions
- Establishing marine protected areas
- Monitoring pollinator populations
| Connection Type | Protection Method | Success Rate |
|---|---|---|
| Migration Routes | Protected Corridors | 75% |
| Breeding Grounds | Restricted Access | 82% |
| Feeding Areas | Habitat Restoration | 68% |
| Marine Networks | No-Take Zones | 71% |
| Pollination Links | Buffer Zones | 79% |
Powerful Tools For Measuring Biodiversity
Food webs serve as powerful tools for understanding and measuring biodiversity in ecosystems. These intricate networks reveal the complex relationships between species while providing crucial insights into ecosystem health and stability. Through food web analysis scientists can identify critical species assess ecosystem vulnerability and develop targeted conservation strategies.
By protecting and maintaining these vital ecological connections we can help preserve biodiversity for future generations. The study of food webs continues to be essential for conservation efforts offering a clear path toward sustainable ecosystem management and species protection.
